Reproducible analysis: literate programming
Issue
When starting off as a beginner doing data analysis you often start with hacking together some scripts. You pick whatever you can find, throw it in the mix and let everything run. These scripts create output like plots, tables, … which you manually copy afterwards into some document. There are several reasons why this is frankly an excruciating way of working:
- if some output changes you have to manually copy the changed results to the document where you write the analysis
- changing some parameters of your analysis requires rerunning everything
- the explanation of what your code does is totally decoupled from the code itself
All this doesn’t really favor reproducible analysis. Hence a paradigm shift, literate programming. Literate programming means you explain what your code does at the same time and place where you write the code. An excellent way to put this into practice is using a package structure to write your analysis with vignettes. Vignettes combine code and descriptive text in the same document using rmarkdown. Vignettes can also be output to html which makes it ideal to be published as blog posts. Even more, it’s an excellent way of doing it since you can tap into all a package has to offer (testing, documentation) which greatly benefits your analysis as well.
Solution
Vignettes are supported by default in devtools.
Create the vignette
First of all we use devtools to create a vignette. This vignette will be our analysis file.
use_vignette("nottingham-temperatures")
Note you can’t run devtools:use_vignette anymore as described in the R packages book. devtools is no longer the owner of this function, it now belongs to usethis. usethis offers plenty more interesting functionality, integration with GitHub (as shown in the package development post) and Travis among other things.
As expected from devtools it does everything necessary to start with a vignette:
- intermediary build files are automatically added to
.gitignore - dependencies are added to
DESCRIPTION - and most importantly the
nottingham-temperatures.Rmdfile has been created
The .Rmd file generated contains some standard setup for knitr (the vignette engine we use). A vignette engine transforms the input file (in our case in rmarkdown format) to the right output (html by default and that’s also what we’re aiming for).
Writing the analysis
We’ll use the vignette as a way to show how the functions we wrote previously can be combined and what their output is. The vignette itself is divided in multiple parts:
- a small introduction
- an explanation of what the input data looks like
- going through the functions in each analysis phase
Some defaults for the image size seem to be off but can be modified.
There actually aren’t a lot of really important things to say about writing vignettes. It’s just a combination of R and Markdown. This cheatsheet shows most of the options available to you. It doesn’t make a lot of sense to go over all of them. Best thing is just to look them up when you need them. Options exist to hide your code, cache results, show warnings or not, …
This is the complete analysis in rmarkdown format.
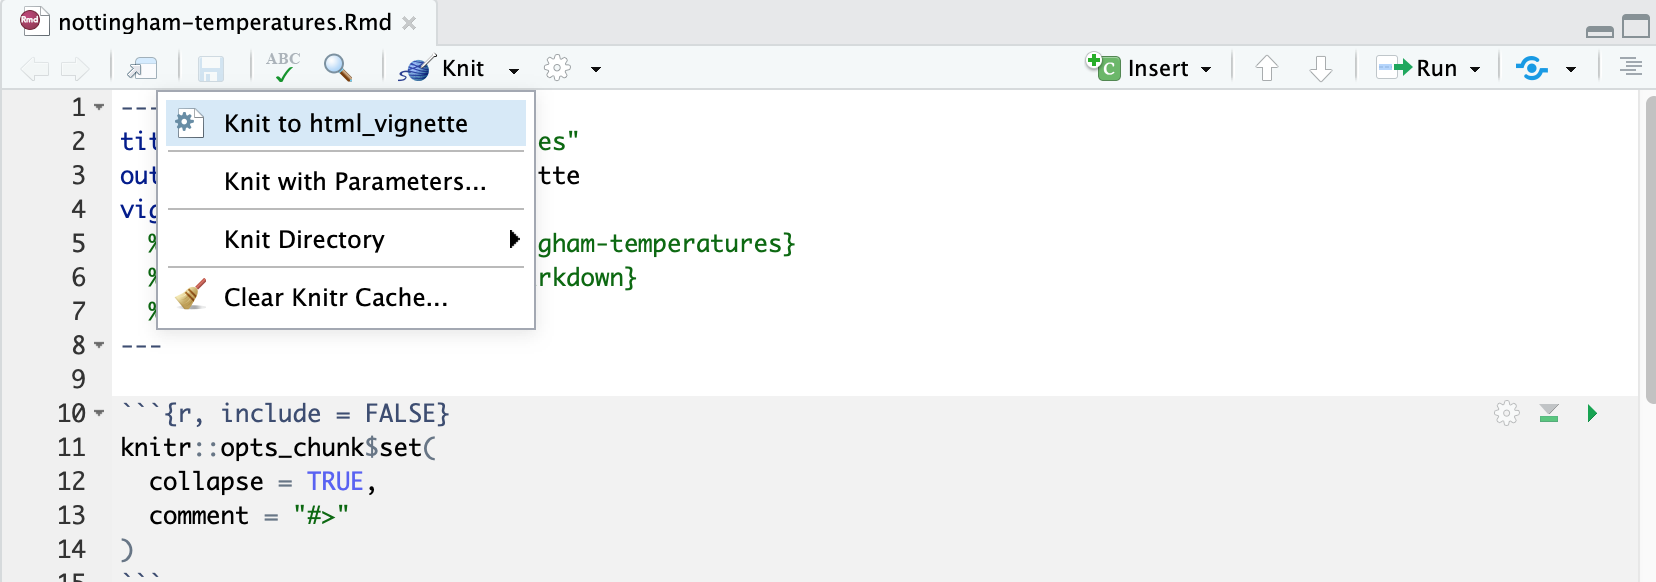
Generating the vignette
By knitting the vignette you get the exported analysis file in the format of your choosing. When using RStudio, which is really the most handy IDE for R, the knitting is completely integrated in the IDE: